PhenoGram
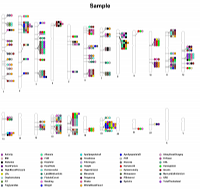
PhenoGram plots phenotypes that have been associated with SNPs or other locations along the genome. The genome is displayed divided into separate chromosomes as below:
Options
Input file
Phenogram accepts a text file as the data input for generating the image. The file must be tab-delimited and recognizes the following headers. The file can contain other headers and PhenoGram will ignore them.
| Recognized Header | Required | Description |
|---|---|---|
| CHR | X | Chromosome number |
| POS | X | Base pair location of the SNP or in the case of a region, the starting location |
| PHENOTYPE | X | Phenotype name (required unless plotting chromosomes only) |
| END | Ending base pair location for a region | |
| NOTE or ANNOTATION | Locations on the plot will be annotated to the right of the chromosomes with values from this column. The labels can be no more than 10 characters in length. | |
| ETHNICITY or RACE or GROUP | Specifies the race/ethnicity for the result. When more than one occurs in the input, the plot will use different shapes to represent them. | |
| COLORGROUP | Specifies a group by name and all phenotypes of the group will share a common color | |
| POSCOLOR | Specified by an integer starting with 1 and lines across chromosome will have same color for same integer |
This sample file has been used to generate the examples on this site
Title
Any text can be entered and will be displayed centered across the top of the plot.
Genome
Selects the genome to draw from the list. The genome information has been drawn from the UCSC browser for the organisms included. The input file CHR column needs to match an ID as listed in the genomes. The currently included genomes are:
- Human GRCh38/hg38
- Human GRCh37/hg19
- Mouse
- Drosophila melanogaster
- other (opens a file upload box for including other genomes by the user)
A genome file can be uploaded by selecting other for genome. The genome file is a tab-delimited file and can contain the following columns. Any of the above genome files can serve as an example.
| Recognized Header | Example | Description |
|---|---|---|
| ID | X | Chromosome identifier |
| SIZE | 155270560 | Chromosome size |
| CENTROMERE | 58632012,61632012 | Start,end of the centromere. If left blank, no centromere will be drawn. |
Phenogram spacing
The following options control the spacing of the phenotypes along the chromosome:
- Standard algorithm places the phenotypes at the matching position along the chromosome with no attempt to avoid overlapping
- Equal distance along the chromosome spaces the phenotypes along the chromosome at equal intervals
- Proximity algorithm minimizes overlaps while placing phenotypes generally near original location
Phenogram color
The following options control the color generation of the phenotype circles on the plot:
- Exhaustive search colors uses a list of colors determined by maximizing the distance in colorspace of each color.
- Grouped colors phenotypes with a common GROUPCOLOR group will all have the same color differing only in brightness.
- Grayscale uses shades of gray
- File for specifying colors (opens a file upload box for specifying colors for phenotypes as shown in this tab-delimited example )
Format
Currently phenogram will produce images in one of the following formats:
- PNG
- JPG
Zoom options
Specifying a chromosome (1-22, X or Y) in the Chromosome text field will result in a plot showing only that single chromosome.A portion of a chromosome can be shown using the Start bp and End bp text fields. The resulting plot will only show the specified portion of the chromosome selected.
Additional options
- Selecting Skip empty chromosomes? will omit any chromosomes in the final plot that do not have data from the input file.
- Selecting Larger font? will increase the font size on the final plot.
- If annotation? is selected, text in the optional annotation column of the in put file will be displayed.
- Cytobands selects the cytobands to display on the final plot.
- Group shape file is an optional tab-delimited file that specifies shapes for specific groups in input file (limited to circle, triangle, square and diamond)
- Phenotype size controls the size of the phenotype circles on the plot.
- Outline circles? draws a black outline around phenotype circles.
- Transparent lines? makes the lines across the chromosomes more transparent.
- Omit chromosome lines? omits the lines marking feature position across the chromosome .
- Thinner lines?decreases thickness of lines across chromosomes.
- Thicker chromosomes? increases the thickness of the chromosome lines.
Cytobands file
If Cytobands is set to other, a file can be uploaded containing banding information for the genome to be plotted. The files come from the UCSC browser and the human GRCh38/hg38 cytoband file can be used as an example.
| Recognized Header | Example | Description |
|---|---|---|
| #chrom | chr1 | Chromosome number or ID. |
| chromStart | 9200000 | Starting base pair position for the band |
| chromEnd | 12700000 | Ending base pair location for the band |
| name | p36.22 | Band name |
| gieStain | gneg | Determines the color of the band on the plot. |